
A war of attrition on both sides
Analysts today agree on one point: the war between Iran and the United States will not be fought on the military field. It will be fought on the capacity of each economy to withstand the pressure that the other imposes on it. The Wall Street Journal summarised it in August: the question is who will yield first. Trump is stepping up sanctions and the blockade; Tehran is betting that the price of oil will force Washington to back down.[1]
It remains to be seen where this standoff stands. To what extent has Iran actually blocked the strait, and subsequently the region's exports? How does the magnitude of this shock compare with past crises, and how has the market absorbed it? What has China done, what is left in the reserves, and where is the shock really showing: on crude, on refined products, or on interest rates?
One precaution before we begin. The ships' AIS transponders have been switched off since March, so no one can measure the flows directly. All the figures that follow are estimates or satellite reconstructions, and their margins of error add up.
A total shock, then a toll
Right from the first week of the war, Iran achieved a result without equal in the history of maritime shipping lanes. A study published by The Innovation the measurement by crossing two sources: Sentinel-1 radar imagery, which sees through clouds and does not depend on any vessel declarations, and AIS data. The number of boats detected by radar drops from 15.25 in the week of 22 to 28 February to 0.55 in that of 1st to 7 March, a decrease of 97 %. Declared transits fell from 175 ships on 22 February to 9 on 7 March; for oil and chemical tankers alone, the figure dropped from 126 on 2 March to 2 the following day.[2] One detail explains the mechanism: at the same time, traffic counts surge in ports and anchorage areas, up to seven times the normal level. The vessels have not disappeared. They have been diverted, detained and immobilised inside the Persian Gulf.
Since then, the countries in the region, helped by Washington, have been trying to restore crossings. The result is neither closure nor reopening, but a very unstable intermediate situation: in recent weeks, the estimated flow has varied between 5 and 9 million barrels a day, with an average of around 7.[3] On some days, it drops to zero: the Bloomberg tracker recorded no oil tanker passages on 17 August.[4]
It is this instability that matters, more than the level itself. A closed strait would give a flat line at zero; a reopened strait, a flat line at 17 million barrels. Days at 9 million followed by days at nothing describe something else: control exercised on a case-by-case basis. Amos Hochstein, a former White House adviser, explains how Iran goes about this, while denying Trump's claim that the United States has total control of the strait. Tehran threatens one or two ships at a time, demands 48 hours' notice and dictates the shipping lanes to be used.[5] The maths is very profitable: threatening 2 ships costs much less than sinking 50, and the effect on insurance premiums, shipping prices and the risk premium is almost the same. Iran did not want, and probably was not able, to reduce the region's exports to zero. It has set up something else: a political toll, a right of passage that it can withdraw at any time. It is this possibility of withdrawal that constitutes the weapon.
The days of 1 and 2 September show this better than any average. Following an Iranian attempt to lay mines and attacks on merchant vessels, the United States struck Revolutionary Guard targets in southern Iran: Bandar Abbas, Sirik and Qeshm Island.[6] The following day, the US Energy Secretary announced that 17 million barrels had passed through during the day, the highest volume since the start of the war, compared with around 20 million before the conflict. The figure comes from the US administration and calls for caution: in August, the same source put the average at 9 million barrels a day, whereas analysts estimated the flow to be between 4 and 6 million.[7] A 17 million day that follows zero days does not contradict toll roads: it is the proof of them.
Regionally, the effect is much broader, as it adds production halts and transport disorganisation to the maritime blockade. In July, global supply rose by 2.4 million barrels per day to 101.5 million. However, it remains 6.3 million below last year's level, and 8.3 million barrels of Persian Gulf production are still shut-in.[8] In April and May, the region's exports had fallen by around 13 million barrels per day; in June, this fall is down to 10. The blockade is therefore losing its effectiveness as the months go on.
The reason can be summed up in one word: bypassing. Saudi Arabia increased the flow through its East-West pipeline to Yanbu on the Red Sea, with exports rising from 2 to over 5 million barrels a day between the start of the war and June. The Emirates saturated the 380-kilometre pipeline linking Habshan to Fujairah on the Gulf of Oman, which avoids the strait and carries 1.8 million barrels. They are also using the underground storage facility at Mandous, holding 42 million barrels, and since April have been stepping up shipments along the Omani coast with their transponders turned off. In February, almost the entire volume passed through Hormuz; by June, the proportion bypassing it had become the majority, despite a heavily reduced total.[9]
This change goes well beyond the current crisis. A pipeline, a terminal, an underground tank holding 42 million barrels are permanent pieces of infrastructure: they will not disappear when peace returns. If the countries of the Persian Gulf are spending these billions, Hochstein notes, it is because they no longer believe in American protection. This creates a scheduling problem for Tehran: its leverage is at its maximum on day one and diminishes thereafter, because every week of blockade funds the installations that will make the next blockade less effective. A weapon that loses value the more it is used forces the one who holds it to act quickly.
However, this reasoning has a limit, which appeared in September, and it comes from the south. The Houthis took the port of Mocha, in Yemen, and then Perim Island in an amphibious assault: they now hold a foothold on the Bab el-Mandeb strait. One must remain measured about the significance of this gain. The blockade they announced on 20 July is selective, targeting Saudi Arabia, traffic continues to pass at a reduced rate, and they had already shown that they could disrupt navigation in the Red Sea without holding either Mocha or Perim.[10]
By contrast, the effect on the bypass route was direct. As of 10 September, Yanbu was exporting more than 4 million barrels a day, but more than 70 % was heading towards the Suez Canal and the SUMED pipeline, that is to say towards the north and Europe: the southern exit, the one that makes it possible to reach Asia without going through Hormuz, largely closed up. Then the East-West pipeline was suspended as a precaution, before being shut down following drone attacks. Riyadh had to redirect its cargoes towards Hormuz and cancel some of its September deliveries to its European clients.[11] The bypass therefore has its own chokepoint. As long as the Red Sea remains navigable, each month of blockage reduces the value of the Iranian weapon; if Bab el-Mandeb closes in turn, the trend reverses and flows return towards Hormuz.
The greatest shock in history, and why the price didn't follow
On one point, the World Bank's April 2026 report is clear: the Hormuz shock is the largest loss of oil supply in history, and it caused the largest monthly increase in the price of a barrel ever recorded—around 46 dollars in March alone, compared with 17 dollars for the previous record in May 2008. With an initial loss of around 10 million barrels per day, it is almost double that of the 1978-1979 Iranian Revolution.[12]
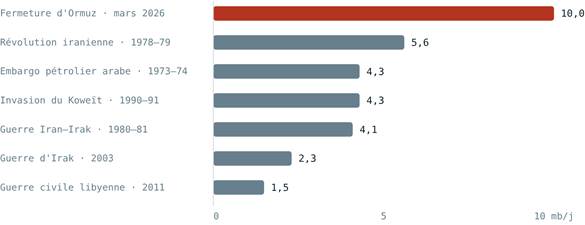
Supply losses at the beginning of major crises, in millions of barrels per day
Sources: International Energy Agency, World Bank. IEA reference periods (2014); values taken from published graphs.
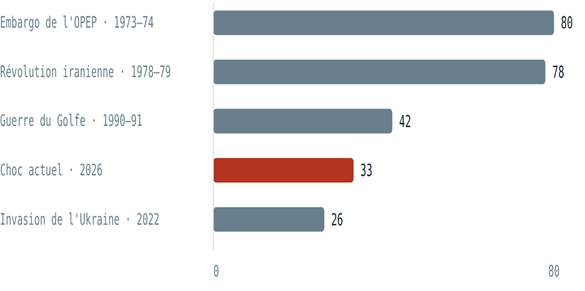
However, the impact of an oil shock is not measured by the volume lost: it is measured by what the price does with it. And there, the ranking is reversed. If we look at the scale of the price rise, the current shock comes behind the OPEC embargo, the Iranian Revolution and the Persian Gulf War — fourth, whereas it is first in volume.[13] This gap is not a statistical fluke: it directly measures the thickness of the shock absorbers. Factors that did not exist, or barely existed, during previous crises acted as buffers. And it is precisely because these buffers existed that Washington deemed the risk acceptable before attacking Iran.
The grid published by the World Bank in autumn 2023, just after the 7 October operation, gives the measure of the gap: minimum scenario, a loss of 1 to 2 million barrels per day for oil at 90-100 dollars; medium scenario, 3 to 5 million for 110-120 dollars; maximum scenario, 6 to 8 million for 140-160 dollars.[14] The actual loss exceeds the upper limit of the maximum-impact scenario, but the price did not follow suit: it remained around 90 dollars for WTI for months and only crossed 100 dollars in mid-September, six months after the shock. Furthermore, the World Bank revised its forecast in April 2026, and its most pessimistic range peaks at around 115 dollars on an annual average basis.[15]
How did the market absorb such a volume? Just before the war, supply exceeded demand by about 2 million barrels a day, a margin that barely covered much more than a week of the impending shock. Between March and May, three mechanisms made up the rest. The International Monetary Fund calculated this.
How the March-May deficit was bridged, in millions of barrels per day, compared to January-February
IMF calculations based on IEA data. March–May deficit before stock draw: −4.1 mb/d, met almost entirely by drawing on global inventories.
The first mechanism, and by far the most powerful, is the drop in demand: 5.8 million barrels per day, which is more than non-Persian Gulf production and destocking combined. It played out mainly in Asia, where rising prices curbed consumption and pushed economies towards coal and renewables. Transport held up better, partly because fuel price caps, subsidies and tax cuts protected consumers — at the cost of a direct hit to public budgets, which is not unrelated to the pressure on interest rates discussed later. The second mechanism is non-Persian Gulf production, which exceeds 2025 levels by nearly 2 million barrels: led by the United States, but also Venezuela, Guyana and Russia. The third is inventories: the remaining deficit, of around 4 million barrels per day, was met almost entirely by drawing on global reserves, including Chinese commercial stocks and strategic reserves.[16] This is the only one of the three that is finite. Demand can remain low for a long time, production outside the Persian Gulf can hold up, but a barrel taken out of a reservoir does not go back in.
The global balance has therefore reversed: from a projected surplus of 3.7 million barrels per day before the war to a projected deficit of around 1.8 million for the third quarter, representing a tightening of 5.5 million.[17] The figure calls for caution: in a market of more than 100 million barrels a day, it represents less than 2 %. The imbalance is real without leading to an unlimited surge, and the shock is seen above all in the risk premium, the cost of maritime transport and the tension on fuels. All on one condition: that stocks continue to play their role as a buffer.
How the Persian Gulf countries paved the way
A curve explains what made this sequence possible: that of global oil inventories, month by month, from 2021 to 2026.[18] It leads to an interpretation that must be presented as such — it’s a reading, not an established fact.
From 2021, the Arab producers of the Persian Gulf pursued a policy of strong oil pressure on the Biden administration. They maintained it until March 2022 and the beginning of the war in Ukraine. Then, despite agreements made with Washington, they made no serious effort to replenish stocks. Saudi Arabia's ability to influence prices was moreover one of the points of disagreement between Biden and Mohammed bin Salman, which the July 2022 trip to Riyadh only partially resolved.
This lever had a clear political price. Riyadh let the White House know that it would agree to increase its production if prices rose too much, to win congressional support for an agreement: the kingdom would recognise Israel and receive a defence pact in exchange.[19] Behind this formula lie two objectives: a treaty-guaranteed American nuclear protection, and permission to enrich uranium on Saudi soil. The 7 October operation made this agreement impossible, and the leverage lost its purpose.
Under the Trump administration, behaviour changes completely. Saudi Arabia and its OPEC partners are putting huge volumes on the market and bringing inventories back to the level of late 2020, that is to say the end of the first term. In May 2025, Reuters and saw it as a subtle gift to Trump: the OPEC+ strategy was driving down prices at the precise moment when concerns over tariffs were mounting.[20]
Hence the interpretation mentioned above. Through their oil policy, the Arab countries of the Persian Gulf created the conditions for two wars. The war in Ukraine first: by keeping global stocks low, they led Moscow to believe that an oil shock and a difficult winter would make the West back down. The war against Iran second: by flooding the market with cheap oil, they led Trump to think that the oil-related consequences of an attack would remain manageable. The data show the sequence of events and the direction of policies; they do not prove intention.
A surprising consequence flows from this. Iranian oil exports have risen — 1.85 million barrels per day in August, the highest level of the year — because sanctions are being enforced less rigorously.[21] Should this be seen as a concession by Washington to Tehran? No: the United States needs every Iranian barrel to fill its reserves, hold the market and maintain pressure on Riyadh. This relaxation is not a favour, it is an admission of weakness. Washington does not physically depend on Middle Eastern oil, since it exports more than it imports; but it needs to control prices, and the difficulties of shale companies make this need greater. It is a dependence on price, not on volume, and that is the weak point of the maximum pressure strategy.
Beijing, reluctant arbiter
If the rest of the world has lost nothing, it means someone has absorbed everything. Tracking global exports is very clear: to destinations other than China, the average during the crisis is the same as before, around 31.2 million barrels a day. To China, it drops from 10.4 to 6.3, with a low of 3.7 at the beginning of August.[22] The physical shock was not shared: it was borne by a single customer.
China did not discover the crisis in March: it had been preparing for it for over a year. Its imports reached a record 11.55 million barrels per day in 2025, with December also a record, and its purchases of Russian crude exceeded 2 million barrels per day in February.[23] When the shock arrives, the adjustment is brutal: its net maritime imports, at 15.3 million barrels per day in January, fall to 7.3 at their lowest, before rising again in part to 9.9.[24]
This curve is as political as it is economic. Beijing appears to have calibrated its withdrawal so that exports to other countries barely budged, preventing the oil shortage from becoming a global crisis. China absorbed the shock instead of letting it spread: a service rendered to the stability of the system, and a significant lever, since it can do the opposite whenever it wants.
Part of the rebuilding of its inventories between March and May came from the drop in its refining, which fell from around 15.2 to 12.5 million barrels per day. This decline appears to have been a choice rather than forced upon it. Moreover, this phenomenon is not unique to China: following the shock, refining is dropping everywhere, with only Europe remaining within its usual range.[25] The world has stopped producing fuels at the rate it is consuming them, which will weigh heavily further down the line.
The decision still remains to be taken. Visible Chinese stocks stand at 1.164 billion barrels, against a capacity of approximately 1.58 billion, which Beijing is expanding by a further 280 million this year. Onshore crude stocks rose from 1,165 to 1,240 million in May, before falling back towards 1,160 in August.[26] China therefore built up its reserves until May, and then began to draw on them. Will it go further, breaking with a trend that has lasted several years, or will it restore its imports at the risk of driving up prices? This is currently the main non-US factor influencing price movements. And the choice is a difficult one: with no prospect of peace, Beijing has no reason to deplete its reserves to ease a market that the continuation of the war will tighten once again.[27]
Some see the drop in Chinese purchases as a betrayal of Tehran. The chronology says otherwise: the massive purchases of 2025 were a preparation, not a withdrawal. Diplomatic actions do too: China vetoed a resolution on the strait and is blocking, along with Russia, the adoption of another. For a country of this weight to defend its long-term interests is by no means a betrayal. Beijing does not like current prices and could change its stance if Tehran remains passive; but the big loser from the closure of the strait is Washington, not Beijing.
Reserves: a dwindling cushion
As inventories are the only limited buffer, their trend is the best indicator we have. It is bad. The global visible oil inventory gauge stands at 7,720 million barrels. Since 1 March, a total of 496 million barrels have been drawn down, averaging 3 million per day; but since the announcement of the US blockade on 13 July, this pace has risen to 6.2 million per day, more than double.[28] Two things must be remembered. The level remains close to that at the start of the war in Ukraine and does not yet constitute a shortage; the trajectory, however, cannot last more than a few months. The window open between the Islamabad agreement and the resumption of fighting in July has closed. Offshore oil, the easiest stock to mobilise, fell from 1.32 to 1.16 billion barrels between July and August.[29]
The tightest situation is in the US, and it comes down to a single barrel. The US strategic reserve has fallen to 319.5 million barrels, its lowest level since 1983, with an estimated minimum operational level of 300 million. This leaves a margin of 19 million barrels: approximately 10 days at the current rate of depletion, or 3 days at the rate observed since 13 July.[30] Refilling it would take years and tens of billions of dollars, and the replenishment launched in 2023 went into reverse with the war. The true floor is a matter of debate: the Department of Energy speaks of 70 million barrels, which Hochstein rejects—going down that low, he says, would mean never being able to replenish it. He adds the crucial point: the markets treat these withdrawals as production, whereas they are neither renewable nor sustainable.[31]
The imbalance is there. China has around 1.4 billion barrels in reserve and a capacity that it continues to expand; the United States has 19 million barrels of leeway. The ratio is roughly 70 to 1. It is this difference, more than any other factor, that explains why the markets are looking to Beijing today and not Washington to find out where the price of a barrel will go. A seemingly mundane curve sums up this reversal: that of US exports and Chinese imports, which have long run parallel, crossing in 2026.[32] The biggest producer and the biggest consumer have swapped roles.
The real front line: diesel and petrol
This is where looking solely at the price of a barrel is most misleading. Three forces are converging on the fuel market. First, the slump in refining, already described. Then, Russian difficulties: from June, Russian net exports of crude and products will fall by about 2 million barrels a day, with diesel taking the lion's share — the world's second-largest exporter of diesel is withdrawing at the worst possible moment.[33] Finally, demand is picking up again: measurable global demand has risen to 50.2 million barrels per day, just 1.1 % below its level a year ago, and the International Energy Agency has recorded an increase of 3.1 million barrels between May and June, driven mainly by diesel and petrol.[34]
Fewer fuels produced, higher fuels demanded: the result is automatic. Refining margins are reaching extreme levels. Diesel is breaking its all-time record and petrol is getting close to it, while crude has long struggled to stay above 90 dollars. Drawing on reserves and short selling helps contain crude, but does not build new refineries: it is on fuels that the damage is appearing.[35]
The difference is one of nature. The price of crude is political: a government can contain it by opening its reserves. The price of diesel is physical: it depends on refining capacity that no administrative decision can create in a few months. And it is diesel, not crude, that sets the cost of road transport, agriculture and logistics — and therefore underlying inflation.
The impact, in fact, extends far beyond oil. The strait handles around 35 % of the world’s crude oil, as well as 28 % of liquefied petroleum gas, 20 % of liquefied natural gas, 19 % of motor fuels — and nearly half of the world’s sulphur.[36] This last figure carries the heaviest consequences: sulphur is used to make sulphuric acid, which is itself used to make phosphate fertilisers. The shock therefore hits the food supply via a very short route. Since 28 February, Singapore kerosene has risen by about 150 %.
From Ormuz to interest rates
The idea that oil drives US long-term interest rates has been demonstrated here in an almost experimental manner. Until February, traffic fluctuated between 40 and 80 vessels per day and the US 10-year yield stood between 3.9 and 4.2 %. From March onwards, traffic plummeted and the yield rose above 4.4 %. The brief upturn in traffic in June coincided with a pause in the rise.[37] Then the trend resumed: 4.71 % in mid-August, 4.80 % on 2 September, and 5.01 % on 15 September — above the 5 % threshold for the first time since July 2007.[38]
This trend is no longer confined to the US; it is now a global phenomenon. Ten-year government bond yields are rising across the board in the US, Germany, Japan, the UK, Italy, France, Switzerland, Canada and Australia, with several markets exceeding their 10-year highs.[39] The Japanese case deserves a mention: the 10-year yield there reaches 3.04 %, its highest since September 1996, and the 2-year and 5-year maturities are at their highest for 31 years.[40] Any shock to this market would have global effects, because Japanese capital invested abroad would return home.
In the United States, three indicators are at historic levels. The nominal 30-year rate stands at 5.34 %, compared with 4.68 % a year earlier. The 30-year real rate has risen above 3.07 %, its highest level since 2002: this is the real cost of long-term borrowing, and its rise reduces the value of all long-term investments. Meanwhile, the TLT, the index fund tracking long-term US government bonds, fell to 82.04 on 14 August, its lowest level since 2004.[41] This fall is a silent alarm: US banks' bond portfolios are accumulating unrealised losses comparable to those that caused the 2023 failures. The MOVE index indicates, however, that we are still quite far from a breakdown. It remains to be seen what might bring us closer to one.
The answer lies in inflation and the doctrine of the Federal Reserve. In July, consumer prices rose by 0.1 % over the month and the core index by 0.2 %; year-on-year, the overall figure returned to 3.4 % and the core figure to 2.5 %, its smallest increase since February, with housing accounting for two-thirds of the rise.[42] Inflation is therefore falling, but slowly, and interest rates continue to express concern. This is due to the weight of oil in this economy: according to recognised models, the oil shock and monetary policy alone account for 75 % of the variations in the personal consumption expenditures price index.[43]
It is often repeated that the Federal Reserve does not react to transitory supply shocks and simply looks through them. But Powell himself has shown the limits of this rule. At the time, he says, it is very difficult to distinguish a supply shock from a demand shock, and just as difficult to know how long it will last. A supply shock that has a lasting impact on production capacity may make a restrictive policy necessary, which then becomes a way of managing risk. And monetary policy must firmly combat any risk of inflation expectations becoming unanchored.[44] The oil shock therefore threatens the markets not through its price level, which remains contained, but through its duration. A short shock is simply let through. A shock that sets in shifts expectations, forces the Fed to tighten its policy and turns a tolerable tension on interest rates into an accident. The decisive variable is not the price, it is the timetable of the war.
The night of 1 to 2 September provided an immediate illustration of this. Taking advantage of a limited clash between Iran and the United States, Brent crude exceeded 99 dollars before falling back to around 96 the following day, while the US 10-year yield reached its highest level since November 2023.[45] We need to measure what this means: in October 2023, this rate had reached its peak of the last two decades, the highest since the 2008 financial crisis. Today, across all major media outlets and serious analytical circles, oil and the Hormuz shock are cited among the main drivers of rising bond yields globally. And it is this very mechanism that is holding Trump back from launching massive strikes against Iranian infrastructure, and that is stalling the American war machine on the escalation ladder.
Two weeks later, the question raised above is no longer relevant. On 15th September, the 10-year yield broke through 5 %, a threshold it had not reached since July 2007, whilst Brent crude rose to 108 dollars, up 19 % over the month. On the same day, the markets priced in around a 92 % probability of an interest rate hike by the Federal Reserve — the first since July 2023.[46] What Powell described in 2023 as a theoretical scenario has become the actual situation: a supply shock lasting long enough to shift expectations, and a central bank that stops looking through it.
Four possible scenarios
Given the state of the American, European and East Asian economies, and above all the Iranian economy, four situations are possible. They are distinguished less by geopolitics than by a single variable: what happens to inventories.
The maintenance of the current situation is the most likely short-term scenario: irregular flow, continuous drawdowns on inventories, growing workarounds, crude between 90 and 110 dollars, and pressure concentrated on fuels. The limit is physical: the US strategic reserve is reaching its floor, and Beijing will then have to choose.
The return to open warfare would suggest that Trump is stepping it up another notch. We would then have to expect very sharp price increases, all the more so as the shock absorbers have already been widely used: the upper part of the World Bank's scale, $140 to $160, would become relevant again, with a risk of global recession.
The negotiation would involve expanding the Islamabad framework into a broader agreement. Inventories would rebuild, flows would slowly normalise, and bypass facilities would remain in place. The International Energy Agency forecasts a 6.3 million barrel per day increase in supply for 2027, reaching 110.3 million, against a 2.4 million increase in demand: the market would return to a surplus and crude would fall back to between 70 and 85 dollars.
L’financial crash, finally, would see the shock pass through long-term yields rather than the barrel: sustainably expensive oil shifts inflation expectations, forces the Federal Reserve to react, and transforms the current tension on interest rates into a crisis. It can happen with a moderate crude price, which makes it difficult to predict.
Except in the case of negotiation, these situations no longer really depend on decisions in Tehran or Washington, but on the rate at which stockpiles are depleting and China's choice. Negotiation is the only scenario where both sides regain control of the timetable. This is why they will undoubtedly come to it, and why neither of them can come to it alone.
Two miscalculated bets
It is based on all of the above that the US strategy shifted: from maximum military offence to maximum economic pressure, in the hope that Iranian society would collapse from within. The stated war aims followed suit: lowering the oil price became one of them, backed by unprecedented financial sanctions intended to force Tehran to reopen the strait. The strategy has well-informed critics, including among those who designed it. Richard Nephew, who built the sanctions regime under Obama, suggests halting the war whilst maintaining pressure, betting on internal attrition rather than force; ;[47] former officials warn that there is no tipping point and that Tehran can withstand much more than Washington thinks.[48] Hochstein describes a president locked in a cage with no door – a diagnosis that fits the state of the reserves: Washington no longer has the means to sustain a long escalation without paying the price at home.
The Iranian problem is of a different nature: political rather than material. The various factions agree neither on how to conduct the war nor on how to build a deterrent capable of preventing a new attack. The faction in favour of normalization is sending signals that sustain hope in Washington for an internal collapse, thereby reinforcing the gamble upon which American pressure is based. Furthermore, no faction is offering a clear project for the future regional order or for the reconstruction of the country: a country that blocks a global trade route without offering anything else eventually comes to be seen merely as a risk. Last but not least, the degraded state of the Iranian economy and the risk of further unrest are precisely what drove Trump to try his luck with a strategy of pressure and waiting.
Both sides have agreed that it is a test of endurance, and both are wrong in certain respects: Washington overestimates Iran's social fragility, while Tehran overestimates the duration of its leverage, which has been shown to lose value every month.
The way out is narrow. It assumes that Iran ramps up tension to a level that does not trigger war, maintains the Islamabad framework and at the same time prepares a broader negotiation leading to a comprehensive agreement – the drafting of which depends entirely on relations between Tehran and Beijing. China does not like playing the mediator, but here it is a matter of avoiding a global recession upon which its economy depends for its exports. This is the only scenario where both sides regain control of a timetable that is slipping away from them. It assumes that Tehran turns a weakening leverage into a political gain while it still can, and that Washington concedes that a margin of 19 million barrels is not enough to finance a war of attrition.
[1]
[1] «The Iran War Is Now About Who Blinks First Under Economic Pressure», The Wall Street Journal, 14 August 2026.
[2]
[2] Xinxia Cao et al., «Satellite radar and AIS reveal a 97 % decline in shipping traffic through the Strait of Hormuz», The Innovation (Cell Press), 1 June 2026.
[3]
[3] Daily reconstitution of estimated flow through Hormuz, 7-day average, June-August 2026.
[4]
[4]Bloomberg, Hormuz Chokepoint Tracker, recorded on 17 August 2026.
[5]
[5] Amos Hochstein, interview with CNBC, August 2026.
[6]
[6]«US strikes IRGC targets in Iran following attempted attacks on vessels in the Strait of Hormuz», The Washington Times, 1 September 2026; «US Launches Fresh Strikes On Iran After Attempted Attacks», RFE/RL, 1 September 2026.
[7]
[7] «Most oil passes through Strait of Hormuz since war began: Chris Wright», Washington Examiner, 2 September 2026. Taking into account the bypass pipelines, the Department of Energy estimates the region’s total output at 21–22 million barrels per day.
[8]
[8]International Energy Agency, Oil Market Report, August 2026.
[9]
[9] IEA, exports from the six Persian Gulf producers by road, February-June 2026.
[10]
[10]«Houthis Make Moves On Red Sea», USNI News, 11 September 2026; MARAD Notice to Mariners 2026-006, Red Sea, Bab el-Mandeb Strait, Gulf of Aden.
[11]
[11]USNI News, 11 September 2026, for volumes from Yanbu and their destination; Trading Economics, Brent Crude Oil, as reported on 15 September 2026, regarding the closure of the East-West oil pipeline following drone attacks and the cancellation of deliveries.
[12]
[12]World Bank, Commodity Markets Outlook, April 2026.
[13]
[13] Price shocks calculated using the Hamilton (1996, 2003) method over a 12-month rolling window.
[14]
[14] World Bank, Commodity Markets Outlook: In the Shadow of Geopolitical Risks, October 2023.
[15]
[15] World Bank and Consensus Economics, price forecast and risk range in the event of widespread disruptions, March–April 2026.
[16]
[16] International Monetary Fund, staff calculations based on IEA data.
[17]
[17]AIE, Oil Market Report, August 2026.
[18]
[18] Monthly series of global oil stocks, 2021-2026.
[19]
[19] «Saudi Arabia Willing to Raise Oil Output to Help Secure Israel Deal», The Wall Street Journal, 6th October 2023.
[20]
[20] Ron Bousso, «Saudi oil price war looks like unspoken gift to Trump», Reuters, 15 May 2025.
[21]
[21] Bloomberg, Iranian oil exports, August 2026.
[22]
[22]Lloyd’s List according to Vortexa, 12 August 2026. Crisis period: 15 March-9 August 2026; reference: same weeks in 2025.
[23]
[23] «China’s 2025 oil imports, December inflows both hit record highs», Reuters, 14 January 2026; «China Secures Record Russian Oil Imports as India Reduces Purchases», OilPrice, 16 February 2026.
[24]
[24] Vortexa and American Petroleum Institute, Chinese net waterborne crude and product imports, 28-day average.
[25]
[25] Kpler, refinery run rates, 2026 compared to the 2021-2025 median.
[26]
[26] Kpler and Ninepoint; capacities estimated by Bank of America and Energy Aspects.
[27]
[27] «The world's strategic oil reserves are running out fast», The Economist, 11 June 2026.
[28]
[28] Goldman Sachs Global Investment Research, global oil stocks visible, data as of 13 August 2026.
[29]
[29] Vortexa, crude and condensate at sea, latest point as of 11 August 2026.
[30]
[30] Department of Energy and Energy Information Administration, US Strategic Petroleum Reserve.
[31]
[31] Hochstein, cited interview.
[32]
[32] Comparison of US exports and Chinese imports, 2021-2026.
[33]
[33] Goldman Sachs Global Investment Research, Russian net exports of crude and products, change since 1 January 2026.
[34]
[34] Goldman Sachs Global Investment Research based on IEA, S&P and Kpler; IEA, change in global demand since February 2026.
[35]
[35] Gas oil, petrol and crude futures rebased at the start of the war, August 2026.
[36]
[36] World Bank and IMF, share of global maritime trade passing through the Strait of Hormuz, by product.
[37]
[37] Bloomberg, Hormuz Chokepoint Tracker compared to the 10-year US Treasury rate, 17 August 2026.
[38]
[38]Trading Economics, US 10 Year Government Bond Yield, statements from 2 and 15 September 2026. Factors cited: anticipation of Federal Reserve tightening, massive corporate debt issuance, federal deficit and energy-related geopolitical tensions.
[39]
[39] Haver Analytics, 9 developed markets, August 2026.
[40]
[40] Trading Economics, Japan 10-Year Government Bond Yield, statement dated 15 September 2026.
[41]
[41] Barchart, iShares 20+ Year Treasury Bond ETF, 15 August 2026; 30-year rate, YCharts, 14 September 2026; 30-year real rate, Bloomberg, 17 August 2026.
[42]
[42] United States Consumer Price Index, July 2026.
[43]
[43] Decomposition of the households' consumer expenditure price index.
[44]
[44] Jerome Powell, «Monetary Policy Challenges in a Global Economy» roundtable, 24th Jacques Polak Annual Research Conference, International Monetary Fund, 10 December 2023.
[45]
[45] Trading Economics, Brent Crude Oil, statement of 2 September 2026: $95.81 a barrel following two consecutive sessions of increases, at a 6-week high.
[46]
[46] «10-year Treasury yield hits highest level since 2007 as traders bet a Fed rate hike is coming», CNBC, 15 September 2026; Trading Economics, data as of 15 September 2026 for the 10-year yield and Brent.
[47]
[47] Richard Nephew, «Let Iran Defeat Itself. America Should End the War but Keep Up the Pressure», Foreign Affairs, 28 April 2026.
[48]
[48]Megan Messerly et Sam Sutton, « “There is no breaking point”: The problem with Trump’s plan to economically strangle Iran », Politico, 18 août 2026.

 French
  English